How I do Django APIs in PyCharm

PyCharm
Web Development
I learn so much from watching conference talks, especially live, when I’m vibing with the crowd. But sometimes I watch and think: “Wow, I wish I could show you how awesome that would be in PyCharm.”
That just happened. Here’s the explainer, with a little special something at the end.
Hello, DjangoConf
I recently attended DjangoConf 2024 which kicked off this year’s DSF-PyCharm fundraiser. I attended Felipe’s DRF tutorial where he showed off using PyCharm and even a little bit about endpoints.
Afterwards, I ran into a PyCharm fan who told me what he really likes when using PyCharm for Django. It matched what I really like. Hence, a blog post.
The end is the point
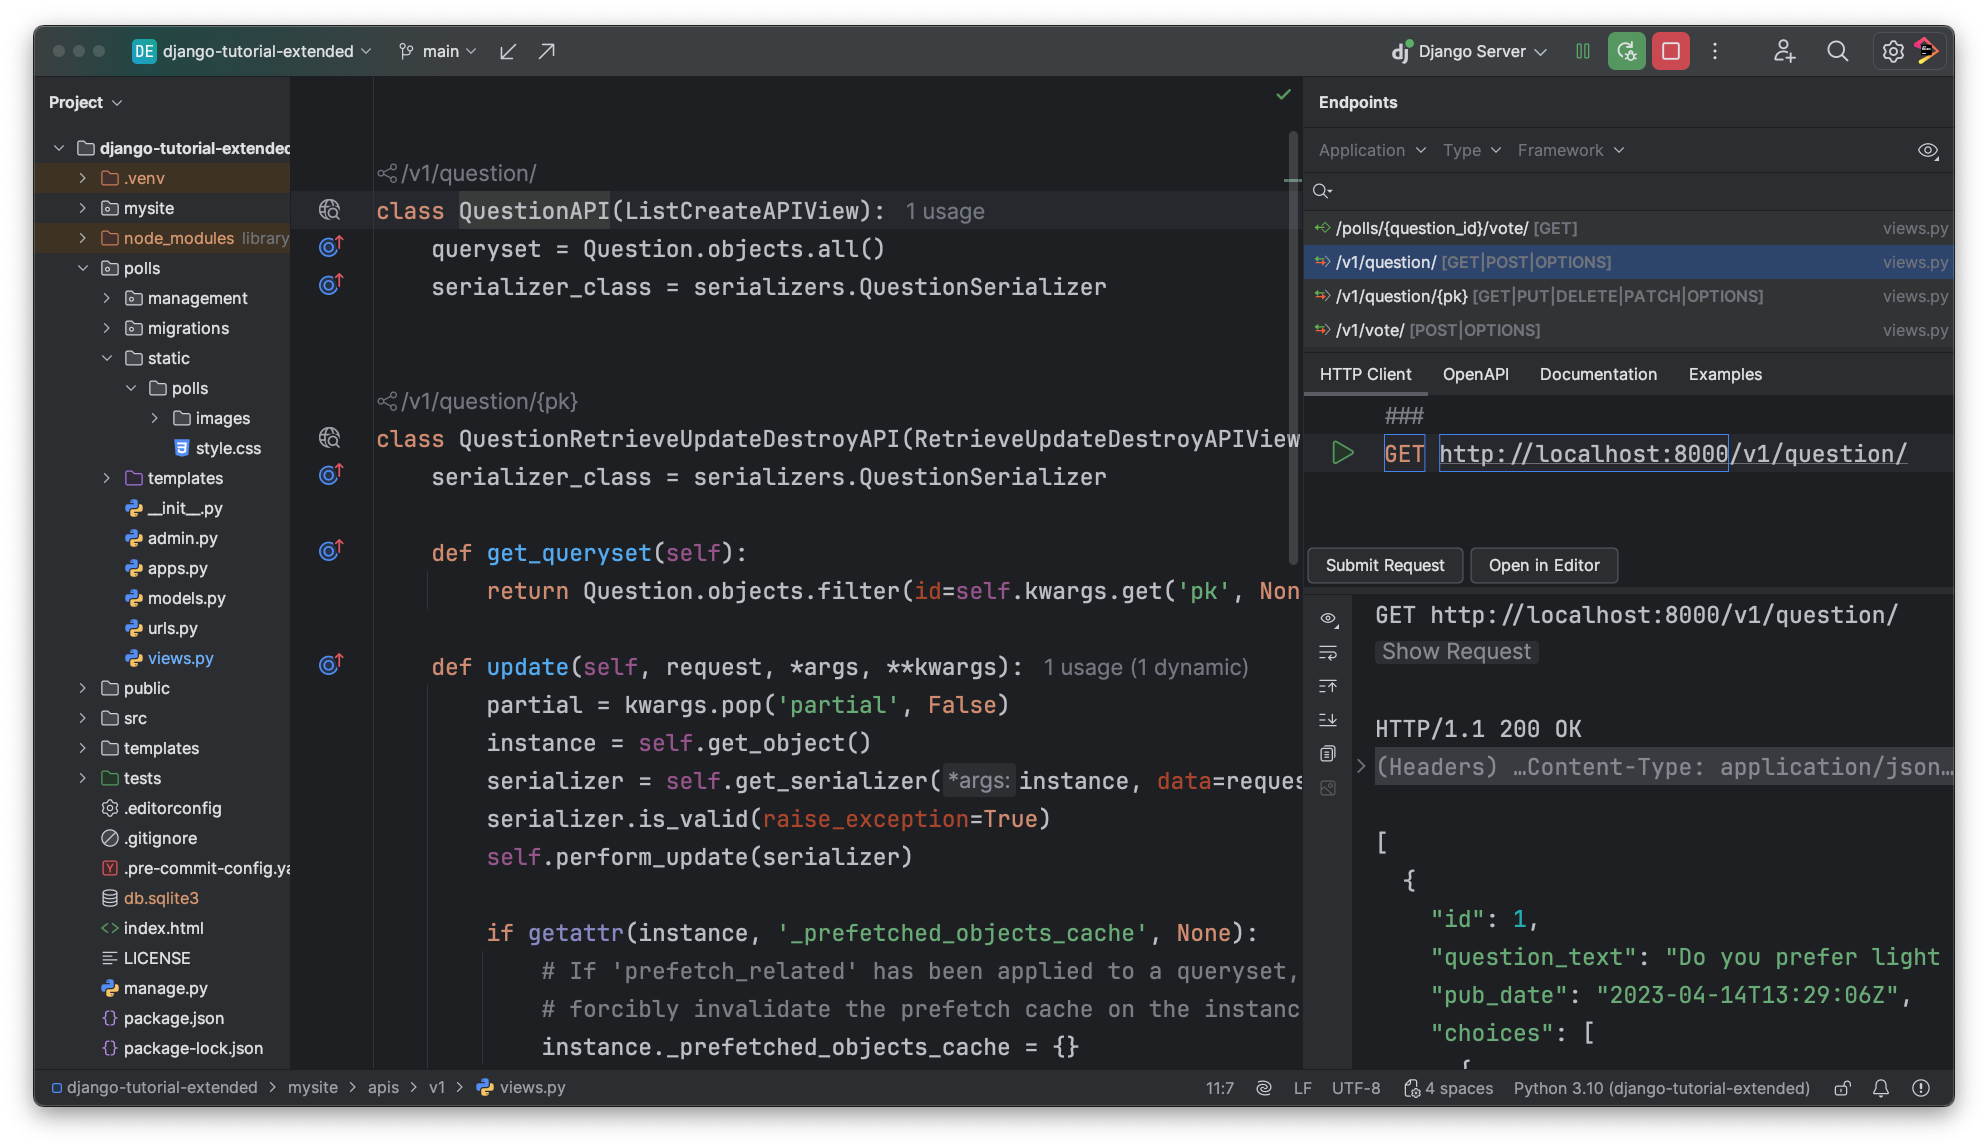
My superfan friend was an early adopter of endpoints, our feature for rethinking the API developer experience (DX) in Django, FastAPI, and Flask. Me too. It’s cool to have a listing of endpoints, jumping to the definition, and most of all – issuing an HTTP request right there in the IDE. No going out to Postman.

I covered endpoints and the HTTP client in my previous blog post. One extra point: he said Postman pricing is going up. I guess I should talk more about the HTTP Client.
Always be debugging
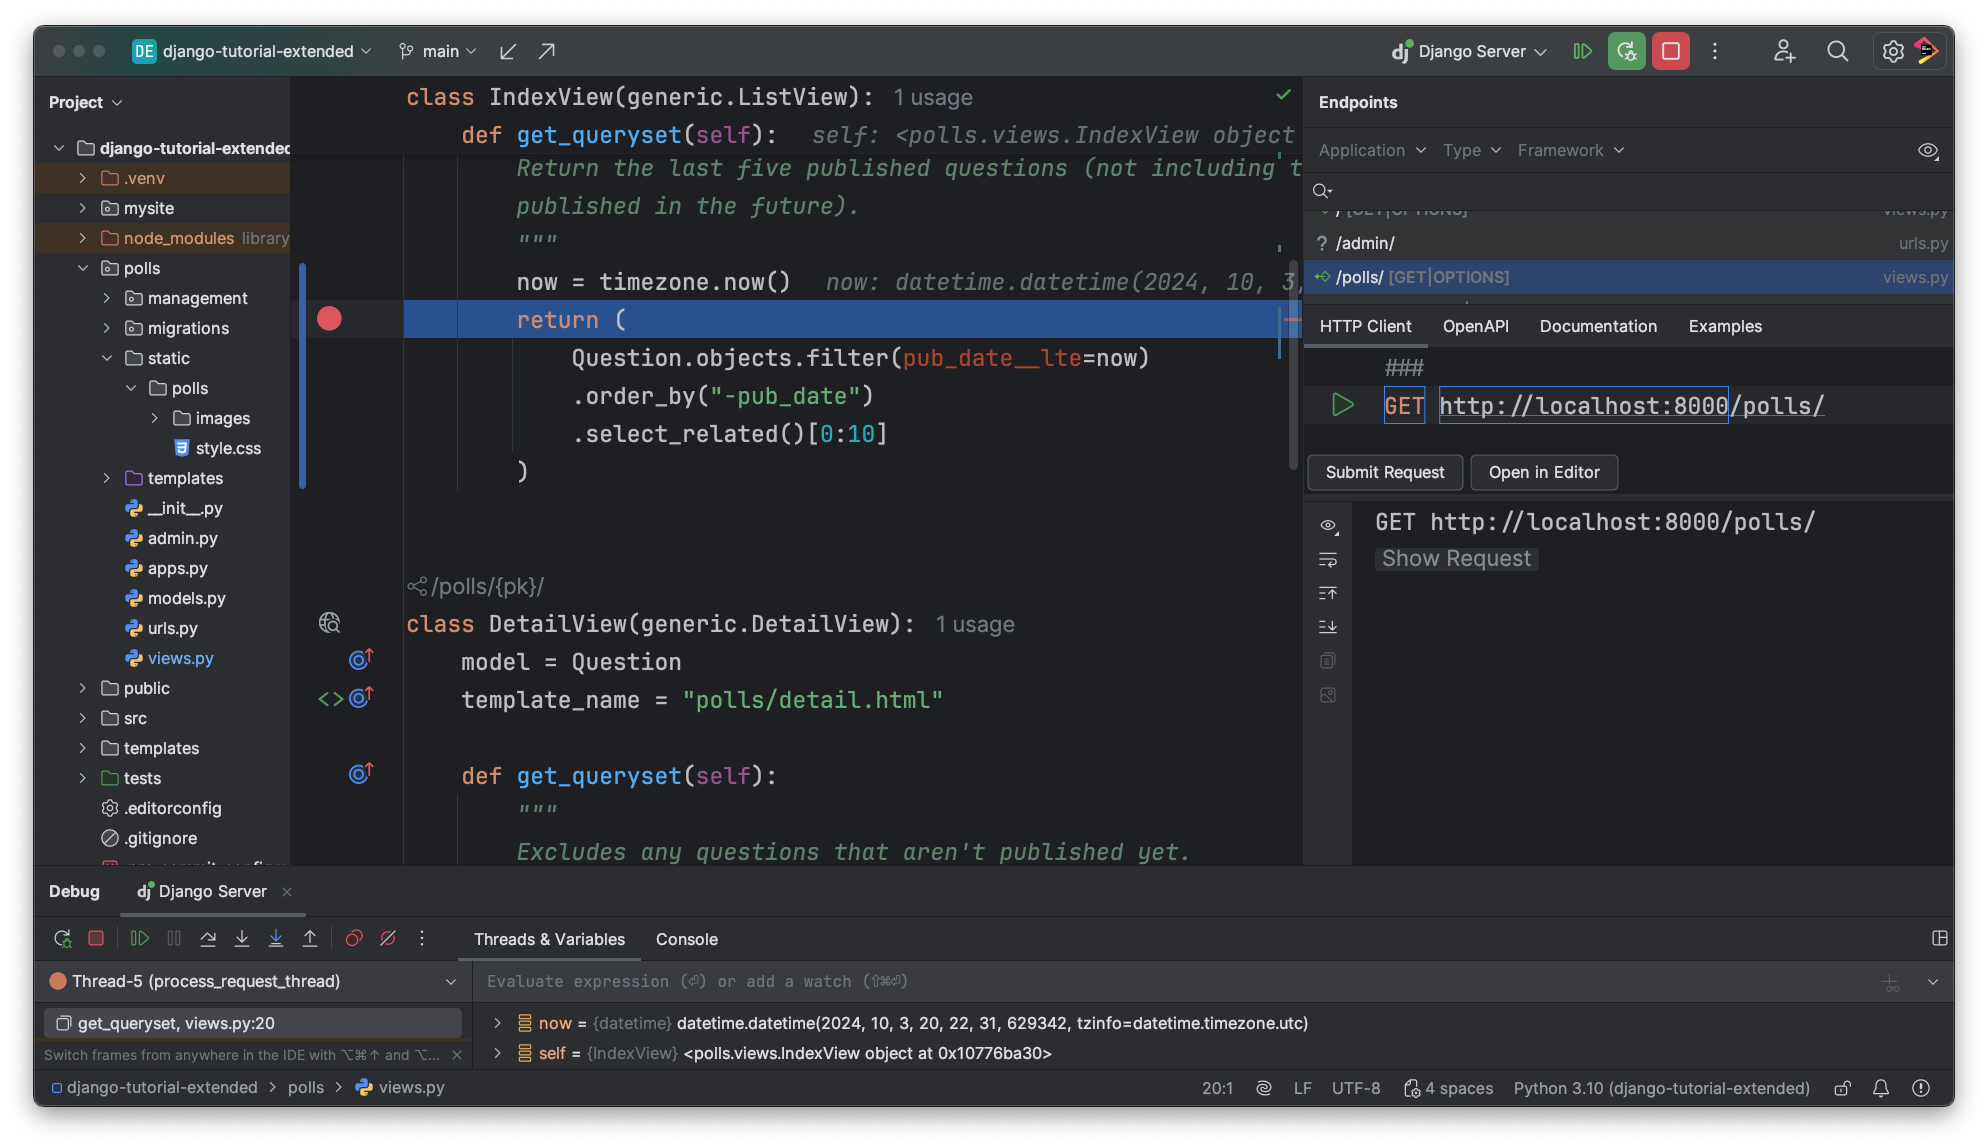
Most folks know that I’m a debugger stan, probably because I just won’t shut up about it. It turns out that he also uses the debugger first, meaning he runs the Django server, under the debugger, all the time, even when he isn’t debugging.

Why? First, it’s so fast, you don’t notice the speed hit. As he also knew, Python 3.12 lowers the impact of debugging and PyCharm uses this automatically. The bigger point though: when you want to poke around, you don’t need to stop the regular “run”, launch under “debug”, then return to “run.” That’s disruptive, so people just do print. Which makes me a sad panda.
If you’re always debugging, then poking around is already RIGHT THERE. Even if you don’t have a bug and just want to investigate. Even if you are in a template.
This is great with endpoints, as you can click a breakpoint in your code and issue a request without leaving the tool.
He made one last point – PyCharm’s Django support and debugger is more mature and polished. We’ve been doing this for a while!
I didn’t know there would be a test
There’s one more step to the higher-zen of using PyCharm to the fullest with Django. Why use the browser or an HTTP client at all? Why not just sit in a test module and let PyCharm + pytest bring joy to your world? In fact – don’t even run Django. No server process, less hassle.
Django makes it really easy to issue fake requests in a test, get the results back, and make sure things are cool. I like having my code on the left, my test on the right, and the test output on the bottom. In fact, I also like combining Always Be Testing with Always Be Debugging, which makes it crazy-easy to stop in the middle of a view and see what’s going on.
I like it so much, here’s a little video:
This works great for how code works. You can skip going to the browser, reloading, and poking around. You stay in the IDE, the flow. But there’s a catch.
Seeing is believing
Sometimes you need to see how the page looks. In the browser. With your eyeballs. Any chance PyCharm can improve the DX for this?
As it turns out, in 2023.3 we shipped Django Preview, a feature-rich browser in the IDE that keeps up as you type.
A love letter to Django
This concludes my speaking from the heart about my way of doing Django API development in PyCharm: endpoints, debugger, testing, and preview.
But I’d like to close by speaking from the heart about Django, leading with an odd little twist of fate about Django killing my project.
Subscribe to PyCharm Blog updates


